Consumer confidence
Consumer confidence is an economic indicator that measures the degree of optimism that consumers feel about the general State of the economy and their personal financial situation. Safe feel people about the stability of their incomes determines their consumption activities and therefore serves as one of the key indicators in the general shape of the economy. In essence, if consumer confidence is higher, consumers are making more purchases, boosting the economic expansion. On the other hand, if confidence is lower, consumers tend to save more than they spend, which causes contractions in the economy. A trend of several months resulting in a decrease in the continued consumer confidence suggests that in the current state of the economy most consumers have a negative view about the ability to find and keep good jobs.
Use
Investors, producers, retailers, banks and Government agencies use various assessments of consumer confidence in planning for their actions. The ability to predict big changes in consumer confidence allows companies to measure the willingness of consumers to make new expenditures. As a result, companies can adjust their operations and the Government can prepare their fiscal policies. If confidence is falling and it is expected that consumers reduced their spending, consequently most of the producers will tend to reduce their production volumes.
For example, if the producers anticipated that consumers reduced their purchases to the retail, especially for products expensive and durable, they will reduce their inventories in advance and can delay the investment in new projects and facilities. Similarly, if banks expect that consumers will decrease your expenses, they will be prepared for the reduction of their lending activities, such as mortgage applications and the use of credit cards. Builders will adapt to likely decrease in the volume of housing construction, and the Government is going to be ready for a reduction of income taxes.
On the other hand, if consumer confidence is improving, people expect to increase their spending on goods and services. As a result, producers can increase production and inventories. Large employers can increase the levels of recruitment. Builders can prepare for higher rates in the construction of houses. Banks can plan an increase in demand for its products of credit and the Government can expect an improvement in tax revenue by increasing consumer spending.
United States
There are several indicators that try to track and measure the confidence of consumers in the United States.
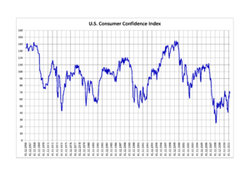
The consumer confidence index
The consumer confidence index (CCI) is a monthly publication produced by The Conference Board, a business group non-profit since 1967. The ICC is designed to evaluate the confidence in general, relative financial health and the purchasing power of the average consumer in the United States. The Conference Board monthly broadcasts three main bulletins: the index of consumer confidence, the index of the current situation, and the expectations index.
Methodology of the ICC
The ICC is based on data from a monthly survey of 5,000 households in the United States. The data are calculated for the United States as a whole and for each of the nine regions of the country voter registration. The survey consists of five questions on the following topics:
- The current conditions of your business.
- The conditions of your business for the next six months.
- The current conditions of their employment.
- The conditions of his employment for the next six months.
- Total family income for the next six months.
Then all surveys are collected, and the positive responses to each question are divided by the total sum of positive and negative responses. The resulting relative value is used as an index value and compares with each monthly value corresponding to the year 1985. That year he was chosen as reference year, since it was not either a maximum or minimum in the economic cycle. The values of the index of the five questions are averaged together to produce the ICC. The average of the values of questions 1 and 3 are the index of the current situation, and the average number of questions 2, 4 and 5 form the expectations index.
index of consumer sentiment from the University of Michigan
The consumer sentiment index (MCSI) is a monthly publication produced by the University of Michigan. The MCSI is designed to measure the attitudes of consumers towards the business climate in general, the State of personal finances and spending of consumers. The University of Michigan reported three newsletters relating each month: the (ICS or MCSI) consumer sentiment index, index of current economic conditions (ICC), and the index of consumer expectations (ICE). The most recent data for ICS have been published by Reuters, the index of consumer expectations is an official component of the index of leading economic indicators of United States.
[edit]Methodology of the MCSI
The index of consumer sentiment (ICS) is based on the monthly telephone survey of household data from the United States. The index is the sum total of five questions on the following topics:
Personal financial situation now and a year ago.
The personal economic situation within a year.
The general financial condition of your company for the next twelve months.
Overall, the financial situation of your company for the next five years.
The current attitude toward the purchase of essential household items.
The ICS is calculated from the scores relating to each of the five index questions: the percentage of favourable responses less percentage of unfavourable responses, by 100. Each relative score is rounded to the nearest whole number. The five relative scores are added together and the sum is divided by 6,7558 (the 1966 base period) and 2 are added to the result (a constant to correct changes in the design of the sample of the 1950s). The ICC is calculated by dividing the sum rounded "relative scores" of questions one and five by 2,6424, and by adding 2. ICE is calculated by dividing the sum rounded "relative scores" of inquiries, two, three and four by 4,1134 and by adding 2.3
[edit]Index of comfort of the consumer of the ABC News-Washington
The index of comfort of the consumer of the ABC News-Washington represents a moving average based on telephone interviews 1,000 adults in all United States monthly. The survey began in December 1985. The index is based on ratings of the economy, the climate for buying consumer and personal finance.
[edit]The consumer comfort index methodology
The consumer comfort index performs three questions about the following topics:
The national economy, ("do as the situation of the country's economy can be described in these days: excellent, good, not so good or poor?")
About personal finances ("do describe the State of their personal finances these days as excellent, good, not so good, or evil?")
The climate to buy ("taking into account the cost of things today and your personal finances, would say that now is a great time, a good time, a time not so good, or a bad time to buy the things they want and need?")
The index is obtained by subtracting the negative response to each question with a positive response. The three resulting numbers are added and divided by three. The rate may vary from 100 (each is positive on all three measures) to - 100 (negative on all three measures).
Average consumer confidence index
Average consumer confidence index
The average consumer confidence index (CCAI) is a monthly aggregation of data from three of the main national surveys on consumer confidence. Represents average consumer confidence index conducted by the Conference Board, the confidence index of the University of Michigan consumer and the ABC News consumer comfort index rescaling. CCAI is produced and published by StateOfEconomy.com.
Methodology of the CCIC
The CCAI takes into account the historical values of the three indices from January 2002. 0 Average consumer confidence value represents the average value of the weighted average of the three indices. The value of +/-100 the confidence of the consumer average represents one standard deviation from the mean value. The value of +/-200 average consumer confidence represents two standard deviations from the average value and so success.
Canada
The index of confidence of the consumer of Canada has been conducting since 1980. This built from responses to four questions of attitude that represent a random sample of Canadian households. Respondents are asked to give their opinion about the situation of his family in financial terms in the present and future, and the prospects for employment in the short term. You are also asked to assess whether now is a good or a bad time to make a substantial, such as a House, a car or other expensive goods cost.
India
The importance of a confidence index for a country such as the India consumers is evidenced by the fact that consumer spending represents more than 60% of the GDP of the India. The index of confidence of the consumer of the CNBC TV18-Boston Analytics is derived from a monthly survey of 10,000 respondents directed through fifteen cities in the India; Delhi, Mumbai, Calcutta, Chennai, Hyderabad, Bangalore, Ahmedabad, Chandigarh, Nagpur, Kochi, Jaipur, Lucknow, Bhubaneshwar, Patna and Visakhapatnam through personal interviews. The sample has an objective capture the major contributors of the personal consumption GDP component.
United Kingdom
The barometer of consumer confidence has been operating under the same format across Europe since the beginning of the 1970s. GfK has directed the barometer in the United Kingdom since June 1995. The survey is conducted on a monthly basis, on behalf of the European Commission, which sponsors the same research in countries members of the European Union. The main objective of this research is to monitor the public's confidence in the British economy in general. Each month, the survey collects changes in personal finances, the economic situation in general, inflation, unemployment, the current to buy climate, consumer spending and your savings. Quarterly surveys about purchases of automobiles or real estate and home improvements. The results of the barometer can be obtained by a subscription of 6 months or a year, ranging from May to April.
Spain
The Spanish ICC is produced since 2004. Design the Instituto de crédito Oficial (ICO) based its calculation on the methodology of Michigan. The Centre for sociological investigations (CIS), who is in charge of its publication it is from November 2011.
The ICC is made from a monthly opinion survey with telephone application of questionnaire standardized to a representative sample of the population residing in Spain of 1000 individuals over the age of 16. The sampling procedure is multistage, with selection of primary sampling units (municipalities) of random proportional to each one of the Spanish provinces and secondary units (households) of numbers randomly phone and latest units (individuals) to cross-sex and age quotas.
ICC-CIS publishes on day 3 of each month or the first working day following if festive or weekend.
[edit]Rest of the world
There has not been any systematic attempt to track and measure consumer confidence in the world. The Nielsen Global Consumer Confidence Index measures the confidence, major concerns and spending habits of online consumers in 54 countries on the basis of an annual average. Index is developed based on the confidence of consumers in the labour market, the State of their personal finances and the willingness to spend. It is heard by the company Nielsen (Nielsen Customized Research). In April 2008 the survey included responses from 28.153 users online.
 RSS Feed