Consumer confidence index
The U.S. consumer confidence index, (the consumer confidence index CCI) measures the propensity of private households in the United States. It is published by the Independent Research Institute, "The Conference Board" based in New York. The index is in competition with the University of Michigan consumer sentiment index, the consumer confidence index from Thomson Reuters and the University of Michigan.
Concept
The U.S. consumer confidence index (CCI) is as an early indicator of economic development in the United States. 5000 Representative selected consumers about their consumption plans, in particular the propensity to buy durable consumer goods, are asked to calculate. The monthly report, the consumer confidence survey, measures the confidence, households in the performance of the American economy have. Consumer confidence is considered the Central indicator for consumer spending, which make up two-thirds of US economic output. The market research company that carries out the survey for the Conference Board, shipped nationwide 5000 questionnaires, of which about 3500 will be answered.
The survey consists of five questions on the following topics:
Assessment of the current economic development in the region of the respondent
Prospects for economic development in six months
Current availability of jobs in the region of the respondent
Availability of jobs in six months
Family income for the next six months
The participants of the survey are asked every question "positive", "negative" or "neutral" answer. The Conference Board calculated two sub-indices, which together result in the overall index from all data: the present situation index for the assessment of the current situation and the expectations index, which includes the assessment of future expectations. Opinions about the current behavior have accounted for up to 40 percent of the overall index, expectations about future behavior accounted for up to 60 percent. The preliminary results from the survey of consumer confidence are on the last Tuesday of the month at 10: 00 EST (16: 00 CET) published.
Evaluation
The strengths of the U.S. consumer confidence index (CCI) is the publication of data for the current month. Consumer confidence is a leading indicator of economic cycles. The published information provide information on the current situation and future expectations of the consumers.
Among the weaknesses of the index, that consumers have not the necessary information in advance to make a correct assessment of income such as employment growth. The monthly report contains information about planned spending, but not necessarily be made.
In a period of prolonged economic growth, the purchasing intentions despite declining unemployment can be removed since the brisk demand was already satisfied. However, the purchase projects can increase with rising inflation in the short term, because consumers quickly implement these in anticipation of rising prices, to avoid the price increase.
The financial markets are sensitive to unexpected changes in the index, it is perceived as an early indicator for the economic development as well as rising inflation. CCI and purchasing manager index include such as the case-Shiller index, the FHFA House Price Index or the price of oil to the Group of indicators, development of which clearly affect the stock indices.
In addition to the CCI there are two consumer climate indices in the United States: University of Michigan consumer sentiment index from Thomson Reuters and the University of Michigan, as well as the ABC News consumer comfort index of the Washington Post. While focusing on the labour market situation the question at the Conference Board, the financial situation of households at the Center is the other indexes. Overall, the Conference Board data form a more stable relationship with the economic data as the indexes of the University of Michigan and the Washington Post. The CCI is the most acclaimed consumer confidence index in the media, businessmen and consumers in the United States.
History
Historical overview
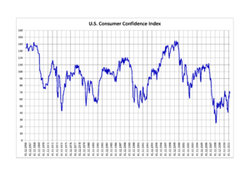
The U.S. consumer confidence index (CCI) was with a base value of 100 points for the first time by the market research Institute "The Conference Board" published in 1985 and expected back until December 1966. The long-term average of the time series of the CCI from 1966 to 2007 is 98.7 index points. 53.9 Points average from 2008 to 2011. The average of the entire time series from 1966 until 2011 is 94.5 points. According to the Conference Board, the border, where the U.S. economy is in a phase of expansion is located at 90 points. The average of consumer confidence in the stable economic development phases is 110 points.
In January and May 2000, the CCI achieved an all time high with 144,7 points. In the course of the financial crisis from 2007 deteriorated the situation in the labour market of the United States. Unemployment grew and the real incomes of workers went back. Accordingly, consumer confidence sank in February 2009 at an all time low of 25.3 points. The two sub-indices to the current situation and expectations experienced a similar development.
The present situation index marked in July 2000 with 186,8 points a record level. Until December 2009, he fell to a low of 20.2 points. Deeper, it was only during the recession from 1980 to 1982. In December 1982, the layer index marked an all-time low with 15.9 points. The expectations index rose in January 2000 to a peak of 119.1 points. Thus, it was only a few points below its all-time high of May 1983 with 124.3 points. Until February 2009, the expectations index at an all time low of 27.3 points dropped.
In February 2011, there were changes in the market research firm, and in the methodology. The Nielsen company took over the monthly survey for the Conference Board by Taylor Nelson Sofres (TNS). States Census Bureau was introduced by the United in a random sample, a subsequent stratification by means of weighting for gender, income, geography and age, as well as the X-12-ARIMA seasonal cleanup procedures. The change in methodology has led to a higher consumer confidence as originally published. The new index showed 57.8 points for November, 2010 (previously 54.3 points), 63.4 points for December, 2010 (previously 53.3 points) and 65.6 points for January, 2011 (previously 60.6 points). In February 2011, a value was calculated by 72.0 points.
In October 2011, was the consumer confidence index to 40.9 points and was the third month in a row below the level of 50 points after August (45.2 points) and September (46.4 points). Consumer confidence was therefore on a level that it had most recently during the recession in 2008 and 2009.
CCI versus U.S. economic data
Consumer confidence in the United States closely correlates with unemployment, inflation, and the actual income situation. There is a strong relationship with the consumer behaviour. The sizes match but not necessarily.
Hedonistic, inflation and economic growth is calculated in the United States since 1996. It attempts to quantify the increases in the quality of products. This leads to estimated to lower inflation rates and according to State and industry up to 30 percent higher growth figures. Social services will often be adapted with the rate of inflation. Also the wage policy depends on the rate of inflation. In Germany, a corresponding revision of the national accounts was carried out in 2005.
The following table compares the total index and the individual indexes (location index and expectations index) with inflation, unemployment and the underemployment. In the United States, there are six different unemployment (U-1 to U-6), where the U-3 as the official number is seen, and the U-6 reflects the rate of underemployment.
The U.S. consumer confidence index, (the consumer confidence index CCI) measures the propensity of private households in the United States. It is published by the Independent Research Institute, "The Conference Board" based in New York. The index is in competition with the University of Michigan consumer sentiment index, the consumer confidence index from Thomson Reuters and the University of Michigan.
Concept
The U.S. consumer confidence index (CCI) is as an early indicator of economic development in the United States. 5000 Representative selected consumers about their consumption plans, in particular the propensity to buy durable consumer goods, are asked to calculate. The monthly report, the consumer confidence survey, measures the confidence, households in the performance of the American economy have. Consumer confidence is considered the Central indicator for consumer spending, which make up two-thirds of US economic output. The market research company that carries out the survey for the Conference Board, shipped nationwide 5000 questionnaires, of which about 3500 will be answered.
The survey consists of five questions on the following topics:
Assessment of the current economic development in the region of the respondent
Prospects for economic development in six months
Current availability of jobs in the region of the respondent
Availability of jobs in six months
Family income for the next six months
The participants of the survey are asked every question "positive", "negative" or "neutral" answer. The Conference Board calculated two sub-indices, which together result in the overall index from all data: the present situation index for the assessment of the current situation and the expectations index, which includes the assessment of future expectations. Opinions about the current behavior have accounted for up to 40 percent of the overall index, expectations about future behavior accounted for up to 60 percent. The preliminary results from the survey of consumer confidence are on the last Tuesday of the month at 10: 00 EST (16: 00 CET) published.
Evaluation
The strengths of the U.S. consumer confidence index (CCI) is the publication of data for the current month. Consumer confidence is a leading indicator of economic cycles. The published information provide information on the current situation and future expectations of the consumers.
Among the weaknesses of the index, that consumers have not the necessary information in advance to make a correct assessment of income such as employment growth. The monthly report contains information about planned spending, but not necessarily be made.
In a period of prolonged economic growth, the purchasing intentions despite declining unemployment can be removed since the brisk demand was already satisfied. However, the purchase projects can increase with rising inflation in the short term, because consumers quickly implement these in anticipation of rising prices, to avoid the price increase.
The financial markets are sensitive to unexpected changes in the index, it is perceived as an early indicator for the economic development as well as rising inflation. CCI and purchasing manager index include such as the case-Shiller index, the FHFA House Price Index or the price of oil to the Group of indicators, development of which clearly affect the stock indices.
In addition to the CCI there are two consumer climate indices in the United States: University of Michigan consumer sentiment index from Thomson Reuters and the University of Michigan, as well as the ABC News consumer comfort index of the Washington Post. While focusing on the labour market situation the question at the Conference Board, the financial situation of households at the Center is the other indexes. Overall, the Conference Board data form a more stable relationship with the economic data as the indexes of the University of Michigan and the Washington Post. The CCI is the most acclaimed consumer confidence index in the media, businessmen and consumers in the United States.
History
Historical overview
The U.S. consumer confidence index (CCI) was with a base value of 100 points for the first time by the market research Institute "The Conference Board" published in 1985 and expected back until December 1966. The long-term average of the time series of the CCI from 1966 to 2007 is 98.7 index points. 53.9 Points average from 2008 to 2011. The average of the entire time series from 1966 until 2011 is 94.5 points. According to the Conference Board, the border, where the U.S. economy is in a phase of expansion is located at 90 points. The average of consumer confidence in the stable economic development phases is 110 points.
In January and May 2000, the CCI achieved an all time high with 144,7 points. In the course of the financial crisis from 2007 deteriorated the situation in the labour market of the United States. Unemployment grew and the real incomes of workers went back. Accordingly, consumer confidence sank in February 2009 at an all time low of 25.3 points. The two sub-indices to the current situation and expectations experienced a similar development.
The present situation index marked in July 2000 with 186,8 points a record level. Until December 2009, he fell to a low of 20.2 points. Deeper, it was only during the recession from 1980 to 1982. In December 1982, the layer index marked an all-time low with 15.9 points. The expectations index rose in January 2000 to a peak of 119.1 points. Thus, it was only a few points below its all-time high of May 1983 with 124.3 points. Until February 2009, the expectations index at an all time low of 27.3 points dropped.
In February 2011, there were changes in the market research firm, and in the methodology. The Nielsen company took over the monthly survey for the Conference Board by Taylor Nelson Sofres (TNS). States Census Bureau was introduced by the United in a random sample, a subsequent stratification by means of weighting for gender, income, geography and age, as well as the X-12-ARIMA seasonal cleanup procedures. The change in methodology has led to a higher consumer confidence as originally published. The new index showed 57.8 points for November, 2010 (previously 54.3 points), 63.4 points for December, 2010 (previously 53.3 points) and 65.6 points for January, 2011 (previously 60.6 points). In February 2011, a value was calculated by 72.0 points.
In October 2011, was the consumer confidence index to 40.9 points and was the third month in a row below the level of 50 points after August (45.2 points) and September (46.4 points). Consumer confidence was therefore on a level that it had most recently during the recession in 2008 and 2009.
CCI versus U.S. economic data
Consumer confidence in the United States closely correlates with unemployment, inflation, and the actual income situation. There is a strong relationship with the consumer behaviour. The sizes match but not necessarily.
Hedonistic, inflation and economic growth is calculated in the United States since 1996. It attempts to quantify the increases in the quality of products. This leads to estimated to lower inflation rates and according to State and industry up to 30 percent higher growth figures. Social services will often be adapted with the rate of inflation. Also the wage policy depends on the rate of inflation. In Germany, a corresponding revision of the national accounts was carried out in 2005.
The following table compares the total index and the individual indexes (location index and expectations index) with inflation, unemployment and the underemployment. In the United States, there are six different unemployment (U-1 to U-6), where the U-3 as the official number is seen, and the U-6 reflects the rate of underemployment.
 RSS Feed